
The Problem: A 40-Minute Pipeline That Should Take 10
Why do PySpark pipelines slow down even when the cluster is properly sized and the code is correct? In most cases, the answer is redundant computation – Spark silently re-executing the same joins, filters, and transformations every time an action like count() or write() is called, because no one told it to store the intermediate result.
Our team discovered this firsthand in early 2026 on a production Databricks Runtime 15.x pipeline. The job joined five tables with billions of rows, applied business logic, and wrote enriched output to multiple destinations. Despite correct cluster sizing, runtime had ballooned to 40 minutes – four times the expected 10-minute target. Every aggregation and every write operation was independently re-reading source parquet files and re-executing all five joins from scratch.
The fix was PySpark cache optimization. By persisting the joined DataFrame in memory with a single .cache() call, we eliminated the redundant reprocessing entirely. Execution time dropped by 75%, storage I/O fell from five full scans to one, and the team reclaimed 30 minutes of daily compute that was being wasted on duplicated work through Apache Spark’s lazy evaluation model.
What Causes Redundant Computation in Spark?
Spark uses lazy evaluation. When you write transformations like read(), join(), filter(), or withColumn(), Spark does not execute them immediately. Instead, it builds a logical execution plan called a Directed Acyclic Graph (DAG). The DAG only executes when an action is triggered – operations like count(), write(), or collect().
This is the critical detail that causes redundant processing in Spark pipelines: every action triggers complete DAG re-execution from the original data source. Without persisting intermediate results through caching, Spark recomputes the entire transformation lineage – every read, every join, every filter – each time an action like count() or write() is called. This repeated reprocessing is the primary reason PySpark pipelines run slower than expected.
The Pipeline That Exposed the Problem
The following PySpark code shows the pipeline that exposed the redundant computation problem. It reads a transaction parquet dataset, joins it with customer and product tables, applies a date filter, and then runs three separate aggregations and two write operations – all without caching the joined result:
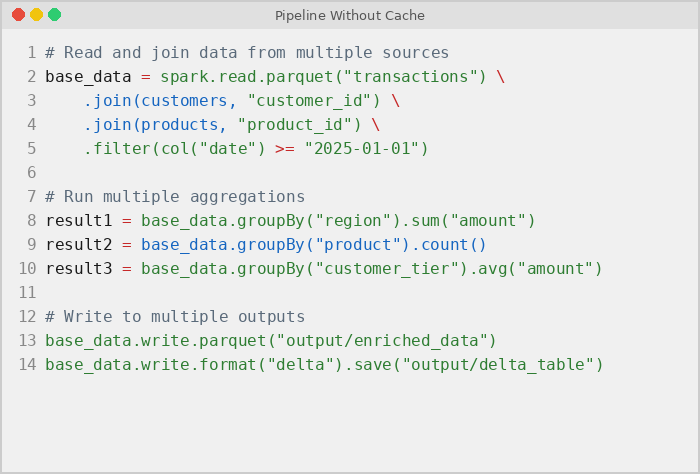
In the pipeline above, Spark re-executes the full transformation chain for every single action. Each of the three aggregations and both write operations independently re-reads the raw parquet files from storage, re-executes both table joins, and re-applies the date filter. That is five complete passes through the entire execution plan where only one is necessary. If each full pass takes 8 minutes, the pipeline wastes 40 minutes on duplicated work that a single cached computation could reduce to 10.
Lazy evaluation is Spark’s greatest strength – until it becomes a liability. Without explicit caching, Spark optimizes each action independently, never realizing it is recalculating the same results repeatedly.
The Fix: How PySpark Cache Eliminated 75% of Runtime
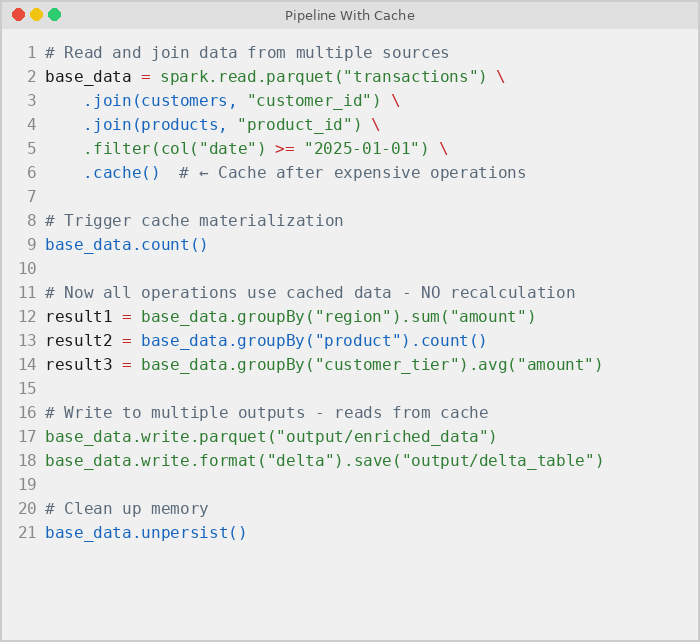
PySpark’s .cache() method solves the redundant computation problem by telling Spark to persist a DataFrame in memory across the cluster after computing it the first time. Instead of re-reading source data and re-running every transformation on each subsequent action, Spark serves results directly from its in-memory store. The first action pays the full computation cost; every action after that benefits from a near-instant memory read rather than a complete pipeline re-execution.
The Optimized Pipeline
Here is the same PySpark pipeline after adding .cache() immediately after the join and filter operations. The cache call tells Spark to persist the joined DataFrame in cluster memory so that all downstream aggregations and writes reuse the stored result instead of re-reading from source:
Measured Performance Gains
After adding a single. cache() call to the PySpark pipeline and deploying it to production in Databricks in Q1 2026, the measured performance improvement was dramatic:
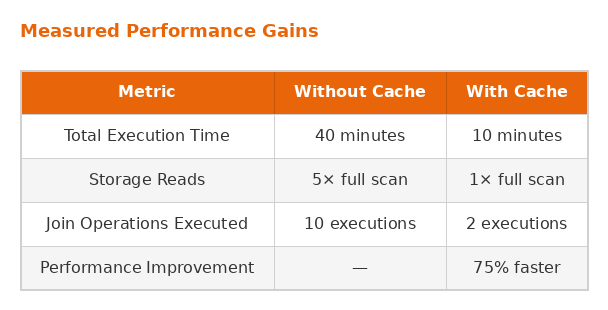
Caching the intermediate DataFrame — the result of joining and filtering all source tables – reduced total pipeline runtime from 40 minutes to 10 minutes. Storage I/O dropped from five full scans to one, and join operations dropped from 10 executions to 2. Across a daily schedule, persisting this single intermediate result translated to significant annual savings in cloud compute costs.
Four Cache Patterns Every Data Engineer Should Know
Pattern 1: Heavy Multi-Table Joins
Joining three or more large tables is one of the most expensive operations in any Apache Spark pipeline. When a PySpark job runs multiple downstream analyses on a joined result without caching, Spark re-executes every join for each action. Persisting the joined DataFrame in memory ensures the expensive join computation happens only once:
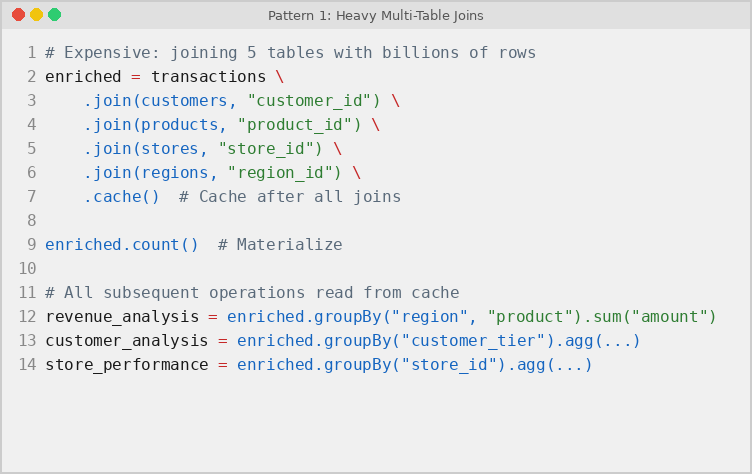
In the example above, five source tables feed three separate aggregation queries. Without caching the joined result, Spark re-joins all five tables for each query – producing 15 total join operations. With PySpark cache applied after the joins, the five-table join executes once and all three queries reuse the stored result, reducing total join operations to just 5.
Pattern 2: Expensive UDF Transformations
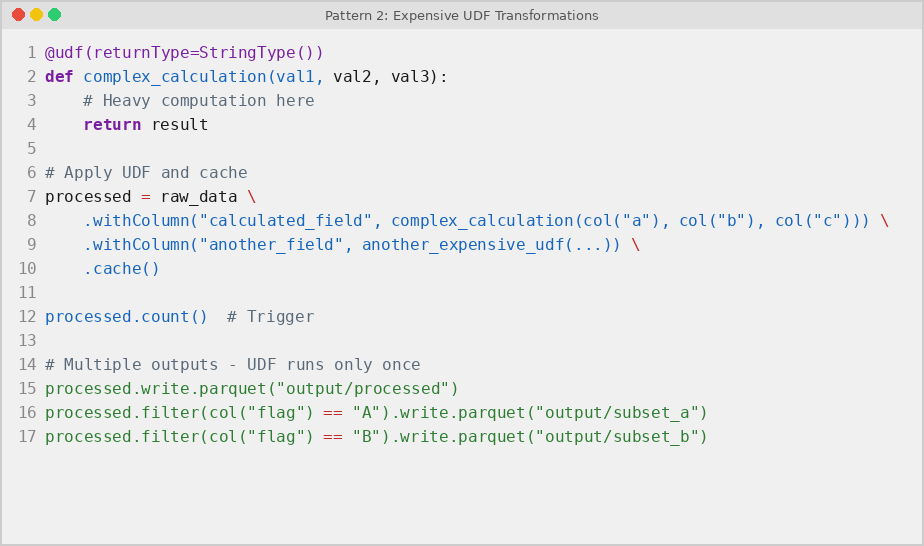
User-defined functions (UDFs) in PySpark bypass Spark’s Catalyst optimizer and execute row-by-row in Python, making them inherently slow. When a pipeline applies expensive UDFs and then writes the result to multiple output paths, each write re-triggers the full UDF computation from scratch. Storing the UDF-processed DataFrame in Spark’s in-memory cache after the transformation step ensures the expensive row-level processing runs only once:
Pattern 3: Iterative Machine Learning Training
PySpark ML algorithms like LogisticRegression and GBTClassifier (available in Spark 3.5 and later) iterate over training data dozens or hundreds of times during model fitting. Without caching the feature DataFrame, every single training iteration re-reads raw data from storage and re-executes all upstream feature engineering transformations – joins, column derivations, and filters. Persisting features in memory before training is critical for any iterative workload:
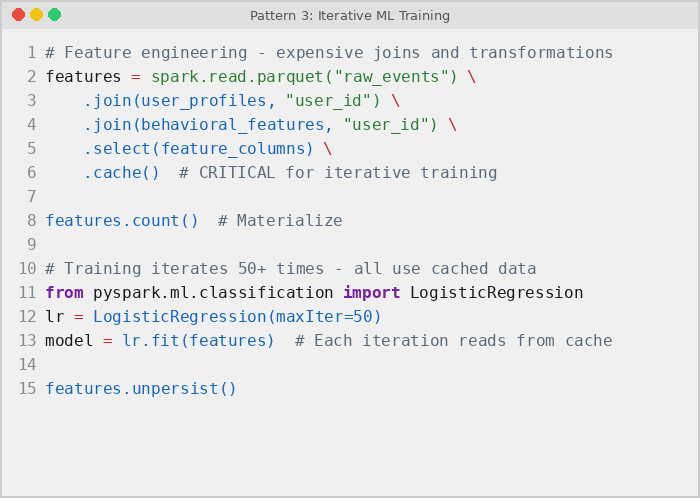
For a LogisticRegression model with maxIter=50, skipping cache means Spark re-reads and re-joins the feature data 50 times. At 5 minutes per full data pass, that amounts to 250 minutes of redundant I/O alone. Caching the feature DataFrame before calling lr.fit() means the data loads into cluster memory once, and all 50 training iterations read from that persisted in-memory snapshot.
Pattern 4: Partitioned Writes at Scale
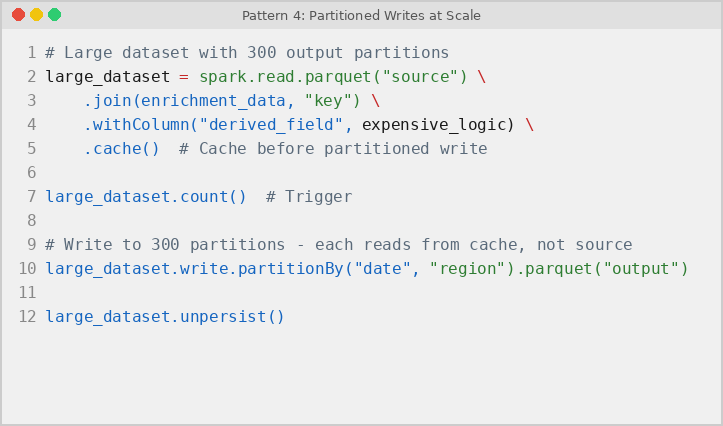
When a PySpark pipeline writes a large dataset to hundreds of partitions using partitionBy(), each partition write triggers a separate Spark action. Without caching the source DataFrame, Spark re-reads and re-transforms the entire dataset for every partition. Storing the processed data in memory before the partitioned write prevents this repeated upstream re-execution:
When Should You Cache in PySpark?
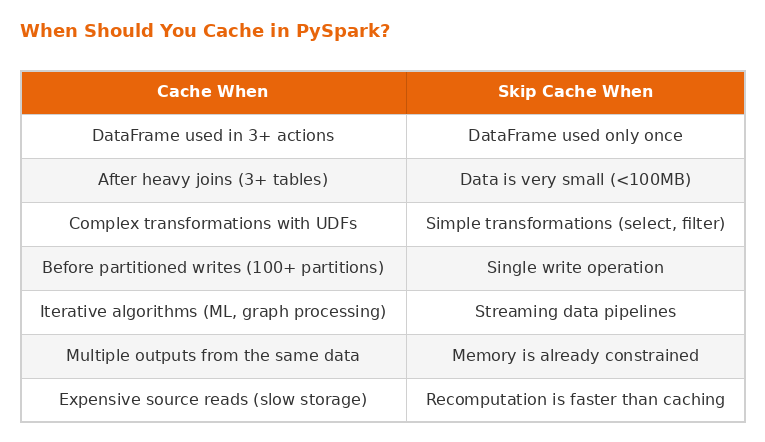
Not every PySpark DataFrame benefits from caching. As of Spark 3.5, the default storage level for .cache() remains MEMORY_ONLY, and persisting a small dataset or a DataFrame that is only referenced by a single action wastes cluster memory without improving performance. The decision to store intermediate results should be based on how many times the data is reused and how expensive the upstream computation is. Use this decision framework:
Two Rules You Cannot Skip
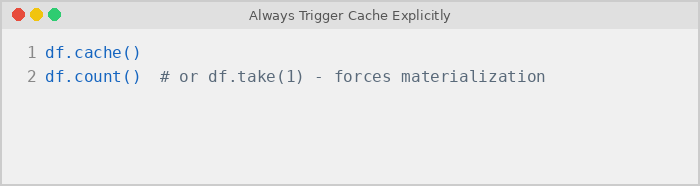
- Always trigger cache explicitly. Calling .cache() only marks the DataFrame for caching. It does not materialize the data. You must follow it with an action:
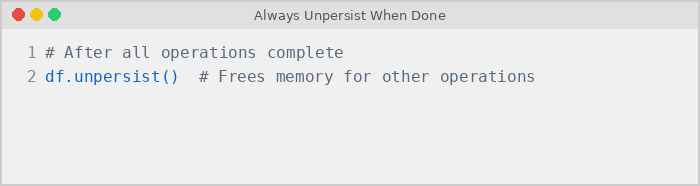
Always unpersist when done. Cached DataFrames consume cluster memory. Leaving them cached indefinitely causes memory exhaustion and can crash your pipeline:
Key Takeaways
PySpark cache optimization is not about writing better algorithms or provisioning bigger clusters. It is about understanding how Apache Spark’s lazy evaluation model causes repeated data processing – and strategically persisting intermediate results to break the re-computation cycle. In our case, adding .cache() at the right point in a single production pipeline cut execution time by 75%, reduced join operations from 10 to 2, and saved meaningful cloud compute costs on a daily schedule.
The principle of storing transformed data in memory for reuse applies universally across data engineering workloads in 2026: heavy multi-table joins, UDF-based transformations, iterative ML training, and large partitioned writes all benefit from the same approach – compute once, persist the result, reuse from memory. If your PySpark pipelines in Databricks or any Apache Spark 3.x environment are slower than expected, start by checking whether Spark is unnecessarily re-executing transformations it has already completed. Eliminating this duplicated work through caching is often the single highest-impact optimization available.
The most impactful optimization in data engineering is not always better algorithms or more powerful infrastructure. Often, it is understanding when to tell Spark: compute this once, then remember it.
Need Help Optimizing Your Data Pipelines?
At ScriptsHub Technologies, we build high-performance data engineering pipelines, AI/ML systems, and cloud-native architectures for businesses across the US, UK, and India. Our team of 40+ specialists works hands-on with PySpark, Apache Spark, Databricks, and modern lakehouse platforms to eliminate exactly the kind of performance bottlenecks covered in this case study – from cache optimization and shuffle tuning to end-to-end ETL pipeline redesign.
If your Spark pipelines are running slower than they should, or if you are planning a data platform migration to the cloud, we can help. Book a free consultation at scriptshub.net to discuss your data engineering challenges with our team. Follow ScriptsHub Technologies on LinkedIn for weekly insights on PySpark performance tuning, AI-powered automation, and production-grade data architecture.
Frequently Asked Questions
Q. Does .cache() execute immediately in PySpark?
No. Calling .cache() only marks a DataFrame for in-memory storage. Data is computed and persisted when the first action (count(), write()) runs. Always follow .cache() with an explicit action to force materialization.
Q. What is the difference between cache() and persist() in Spark?
As of Spark 3.5, .cache() is shorthand for .persist(StorageLevel.MEMORY_ONLY). Both store intermediate results to prevent re-computation. persist() lets you choose storage levels like MEMORY_AND_DISK for when data exceeds available memory.
Q. When should I avoid caching a DataFrame in PySpark?
Avoid caching when a DataFrame is used only once, is very small (under 100MB), or when cluster memory is already constrained. Also skip caching inside Spark Structured Streaming jobs, which manage state internally.
Q. How much memory does PySpark cache use on a cluster?
Spark reserves 60% of each executor’s heap for cached storage by default (spark.memory.storageFraction). Monitor usage via the Spark UI’s Storage tab and always call .unpersist() after downstream operations complete.
Q. Can caching a DataFrame make a PySpark pipeline slower?
Yes. Excessive caching can trigger garbage collection pauses or disk spills. Cache only when a DataFrame feeds three or more downstream actions and upstream computation involves expensive operations like multi-table joins or UDFs.
Leave a Reply