
The Situation: Dashboard Performance Collapse at Peak Load
Our team at ScriptsHub Technologies was brought in to troubleshoot a critical dashboard performance failure on a production operations system built on Angular and .NET Core for a manufacturing client. The application performed well during user acceptance testing with around fifty concurrent users on a staging server. Once the dashboard went live, peak morning logins pushed concurrent sessions past 600 users. The .NET Core API began queuing requests, Angular components rendered stale data, and several widgets returned blank. Organizations facing similar enterprise web application challenges often discover that functional correctness alone does not guarantee production readiness.
Angular’s opinionated module structure and .NET Core’s first-class async pipeline are both well-suited to enterprise-grade applications. The gap was between a dashboard that works in a controlled environment and one that holds up under thousands of simultaneous sessions. According to Microsoft’s ASP.NET Core performance best practices, synchronous blocking calls are the single most common cause of thread pool exhaustion in production .NET applications.
The Diagnosis: Why Dashboard Performance Degrades Under Load
An enterprise dashboard scalability pattern is a set of architectural practices – including asynchronous I/O, server-side caching, client-side request management, and DOM virtualization – that enable a web application to serve thousands of concurrent users without performance degradation. Our diagnosis revealed four root causes behind the dashboard performance failure under load.
Every database call in the .NET Core API layer was synchronous, blocking threads and creating a cascading queue at 600 concurrent users. KPI endpoints recalculated identical aggregations on every request with no .NET Core response caching layer. The Angular front end rendered data tables with 5,000-plus rows directly into the DOM, triggering expensive change detection cycles where Angular virtual scrolling should have been used. No API rate limiting existed, so a single stuck browser tab in a retry loop could monopolize server resources.
Evaluating the Fix
We evaluated two architectural decisions: synchronous versus asynchronous data access, and in-memory versus distributed caching. Microsoft’s distributed caching documentation recommends Redis for any deployment behind a load balancer. The comparison below guided our approach.
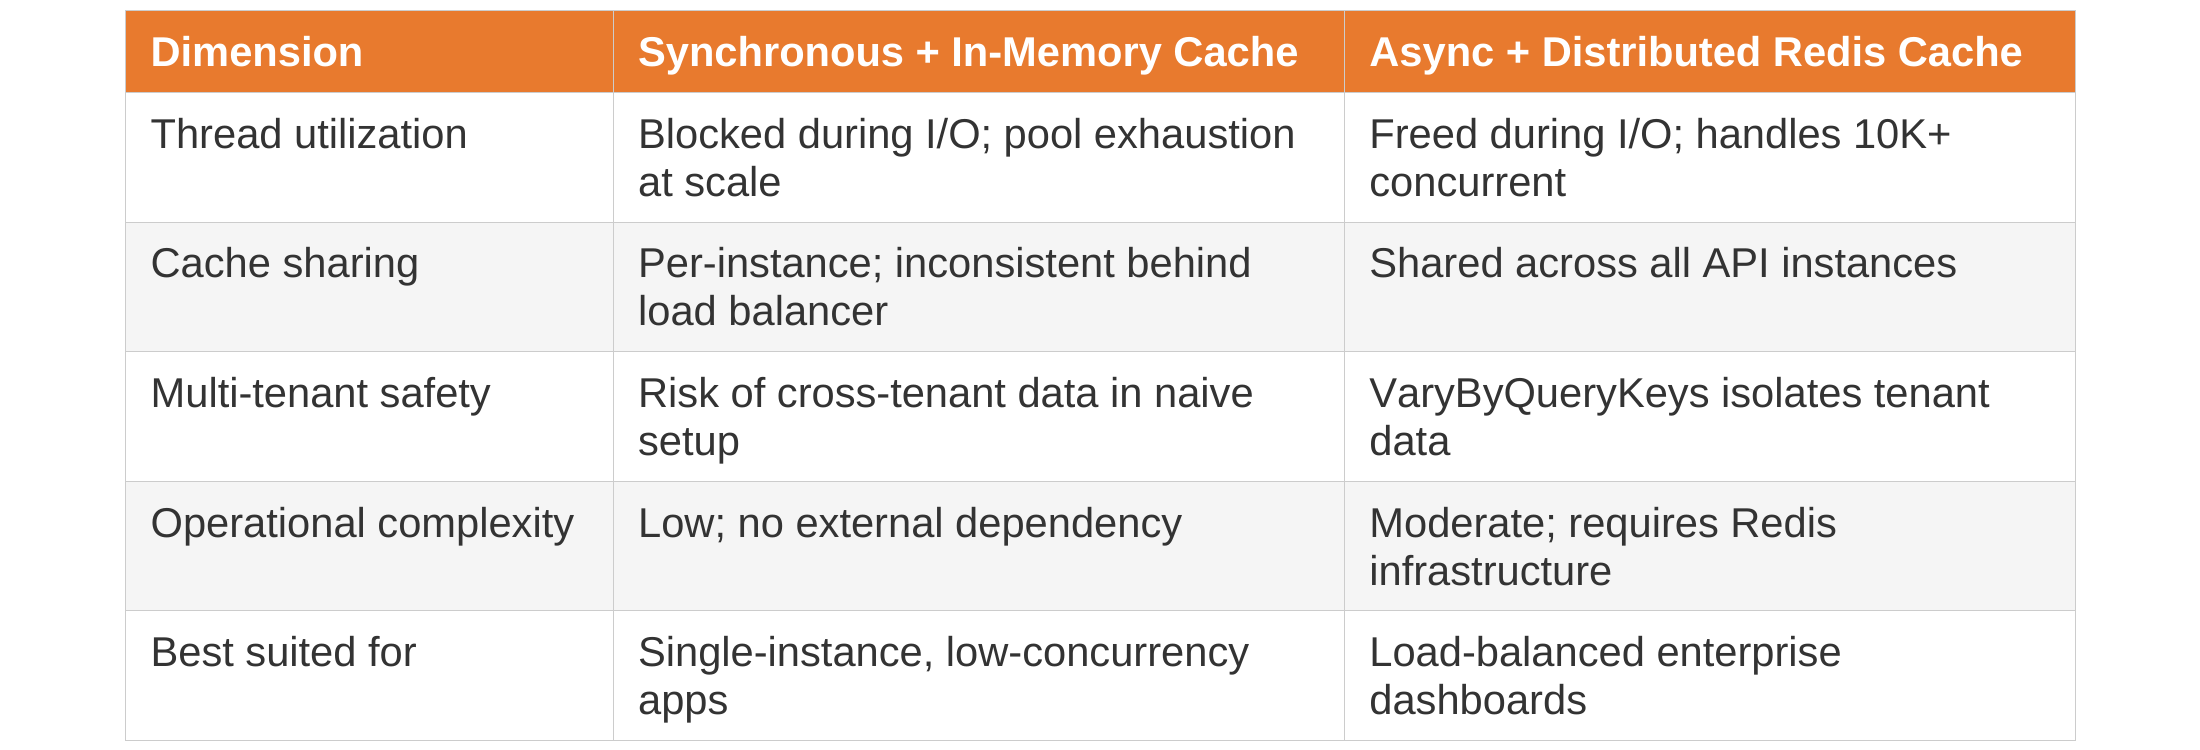
Given the client’s multi-instance deployment behind a load balancer and the need to serve thousands of concurrent dashboard sessions, we selected the async-plus-Redis path for this scalable web application development engagement.
The Fix: Six Patterns to Restore Dashboard Performance
We implemented six targeted patterns across the Angular front end and .NET Core API. Each pattern addressed one of the diagnosed bottlenecks under production load.
Pattern 1:
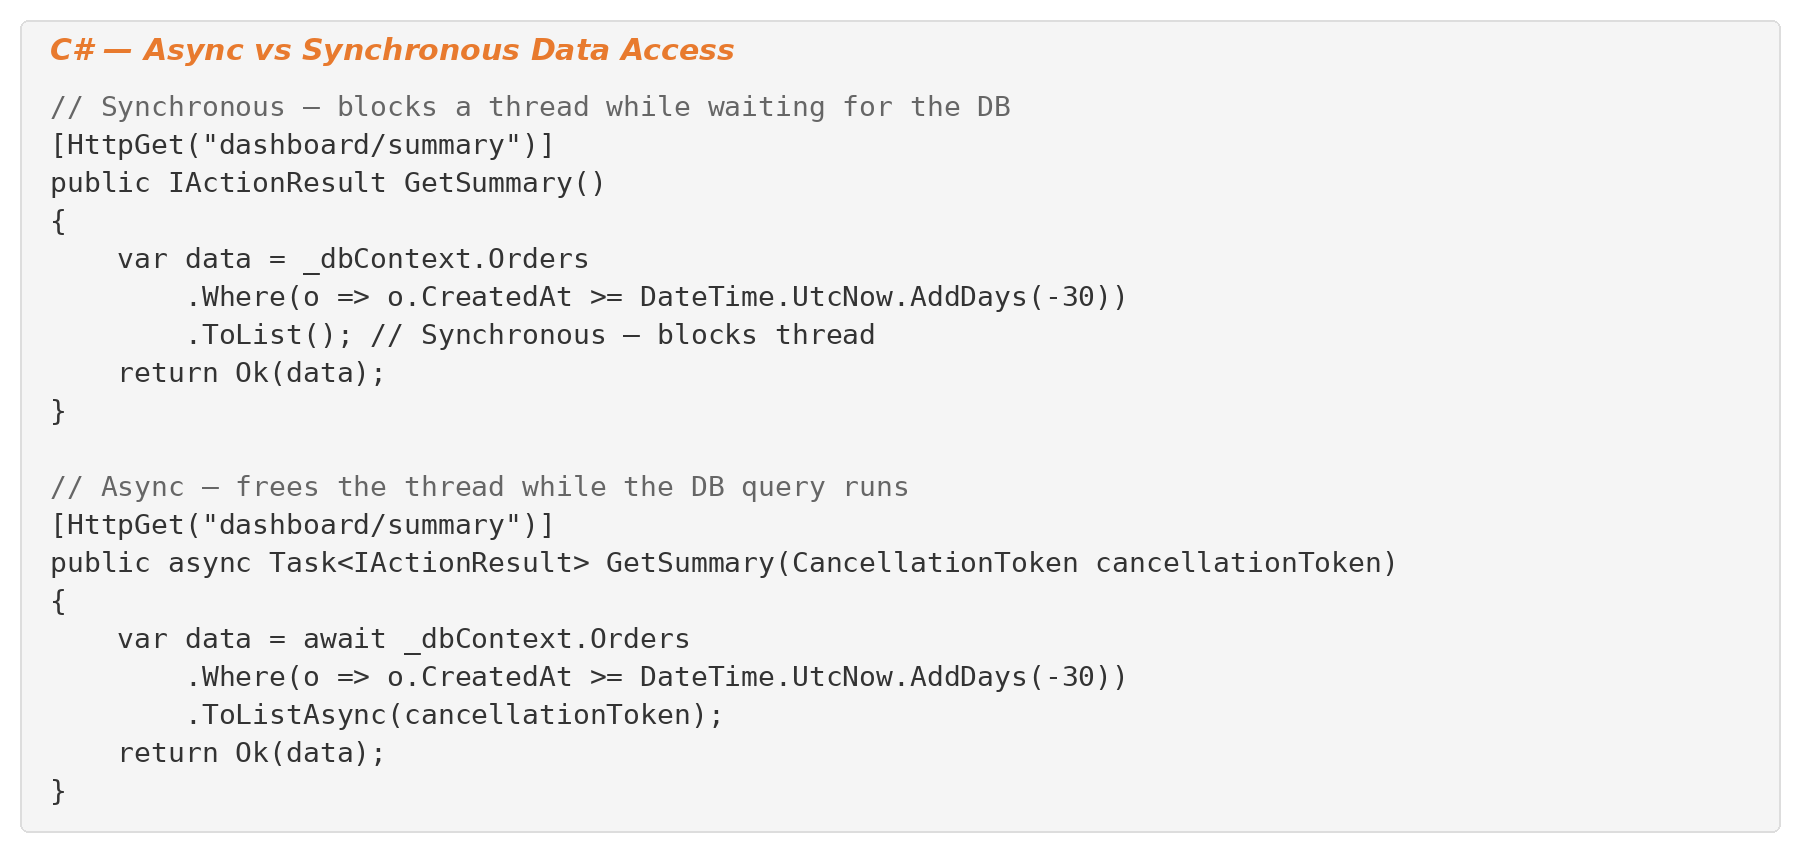
Async Database Access with Cancellation Tokens. Converting every synchronous database call to async was the single most impactful change. Every I/O operation must be awaited so the .NET thread pool remains available under load. We also wired CancellationToken through every endpoint – when a user navigates away, the token ensures .NET stops the database query rather than wasting resources.
Pattern 2:
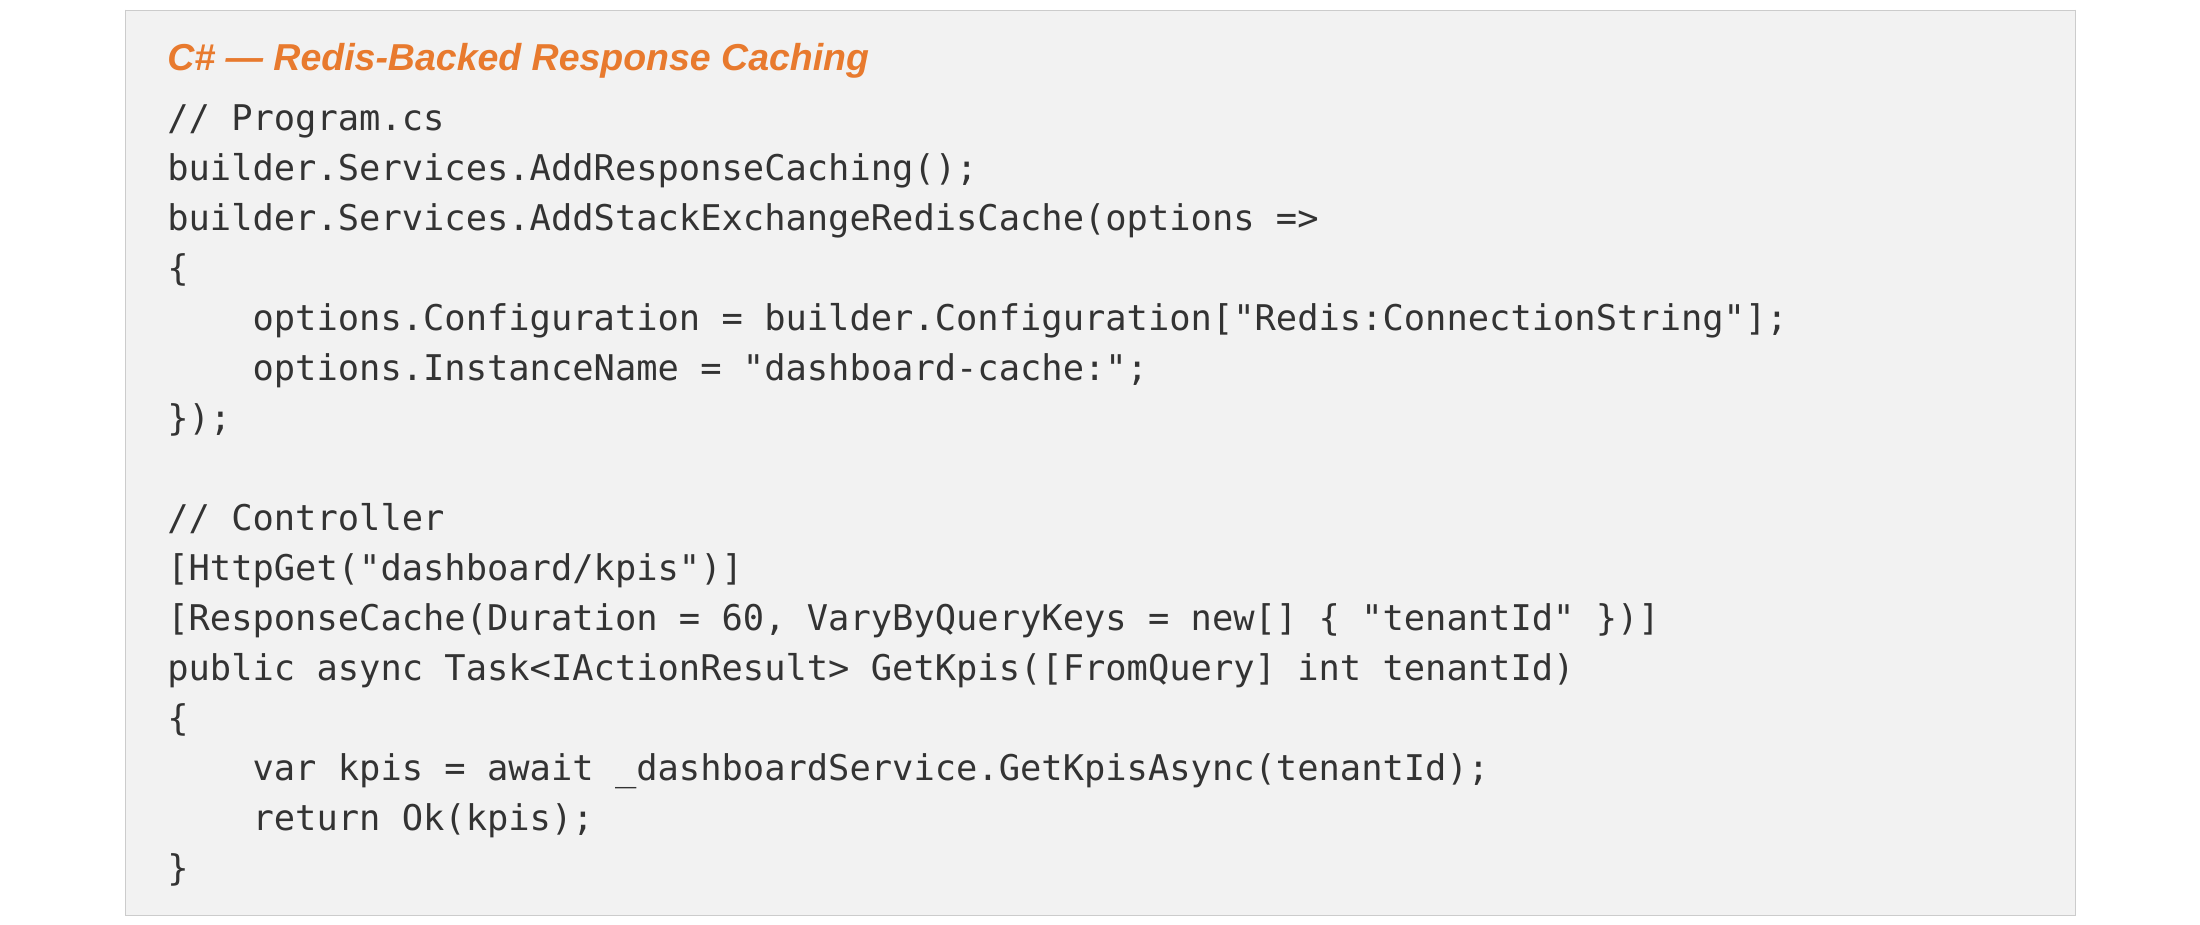
.NET Core Response Caching with Redis. Most dashboard KPI widgets do not need real-time data. A total revenue widget refreshed every 60 seconds delivers the same business value at a fraction of the database load. We implemented .NET Core response caching middleware backed by a distributed Redis cache hosted on the client’s Microsoft Azure cloud infrastructure for consistent behavior across load-balanced API instances. The VaryByQueryKeys attribute with the tenant identifier prevents cross-tenant data leakage.
Pattern 3:
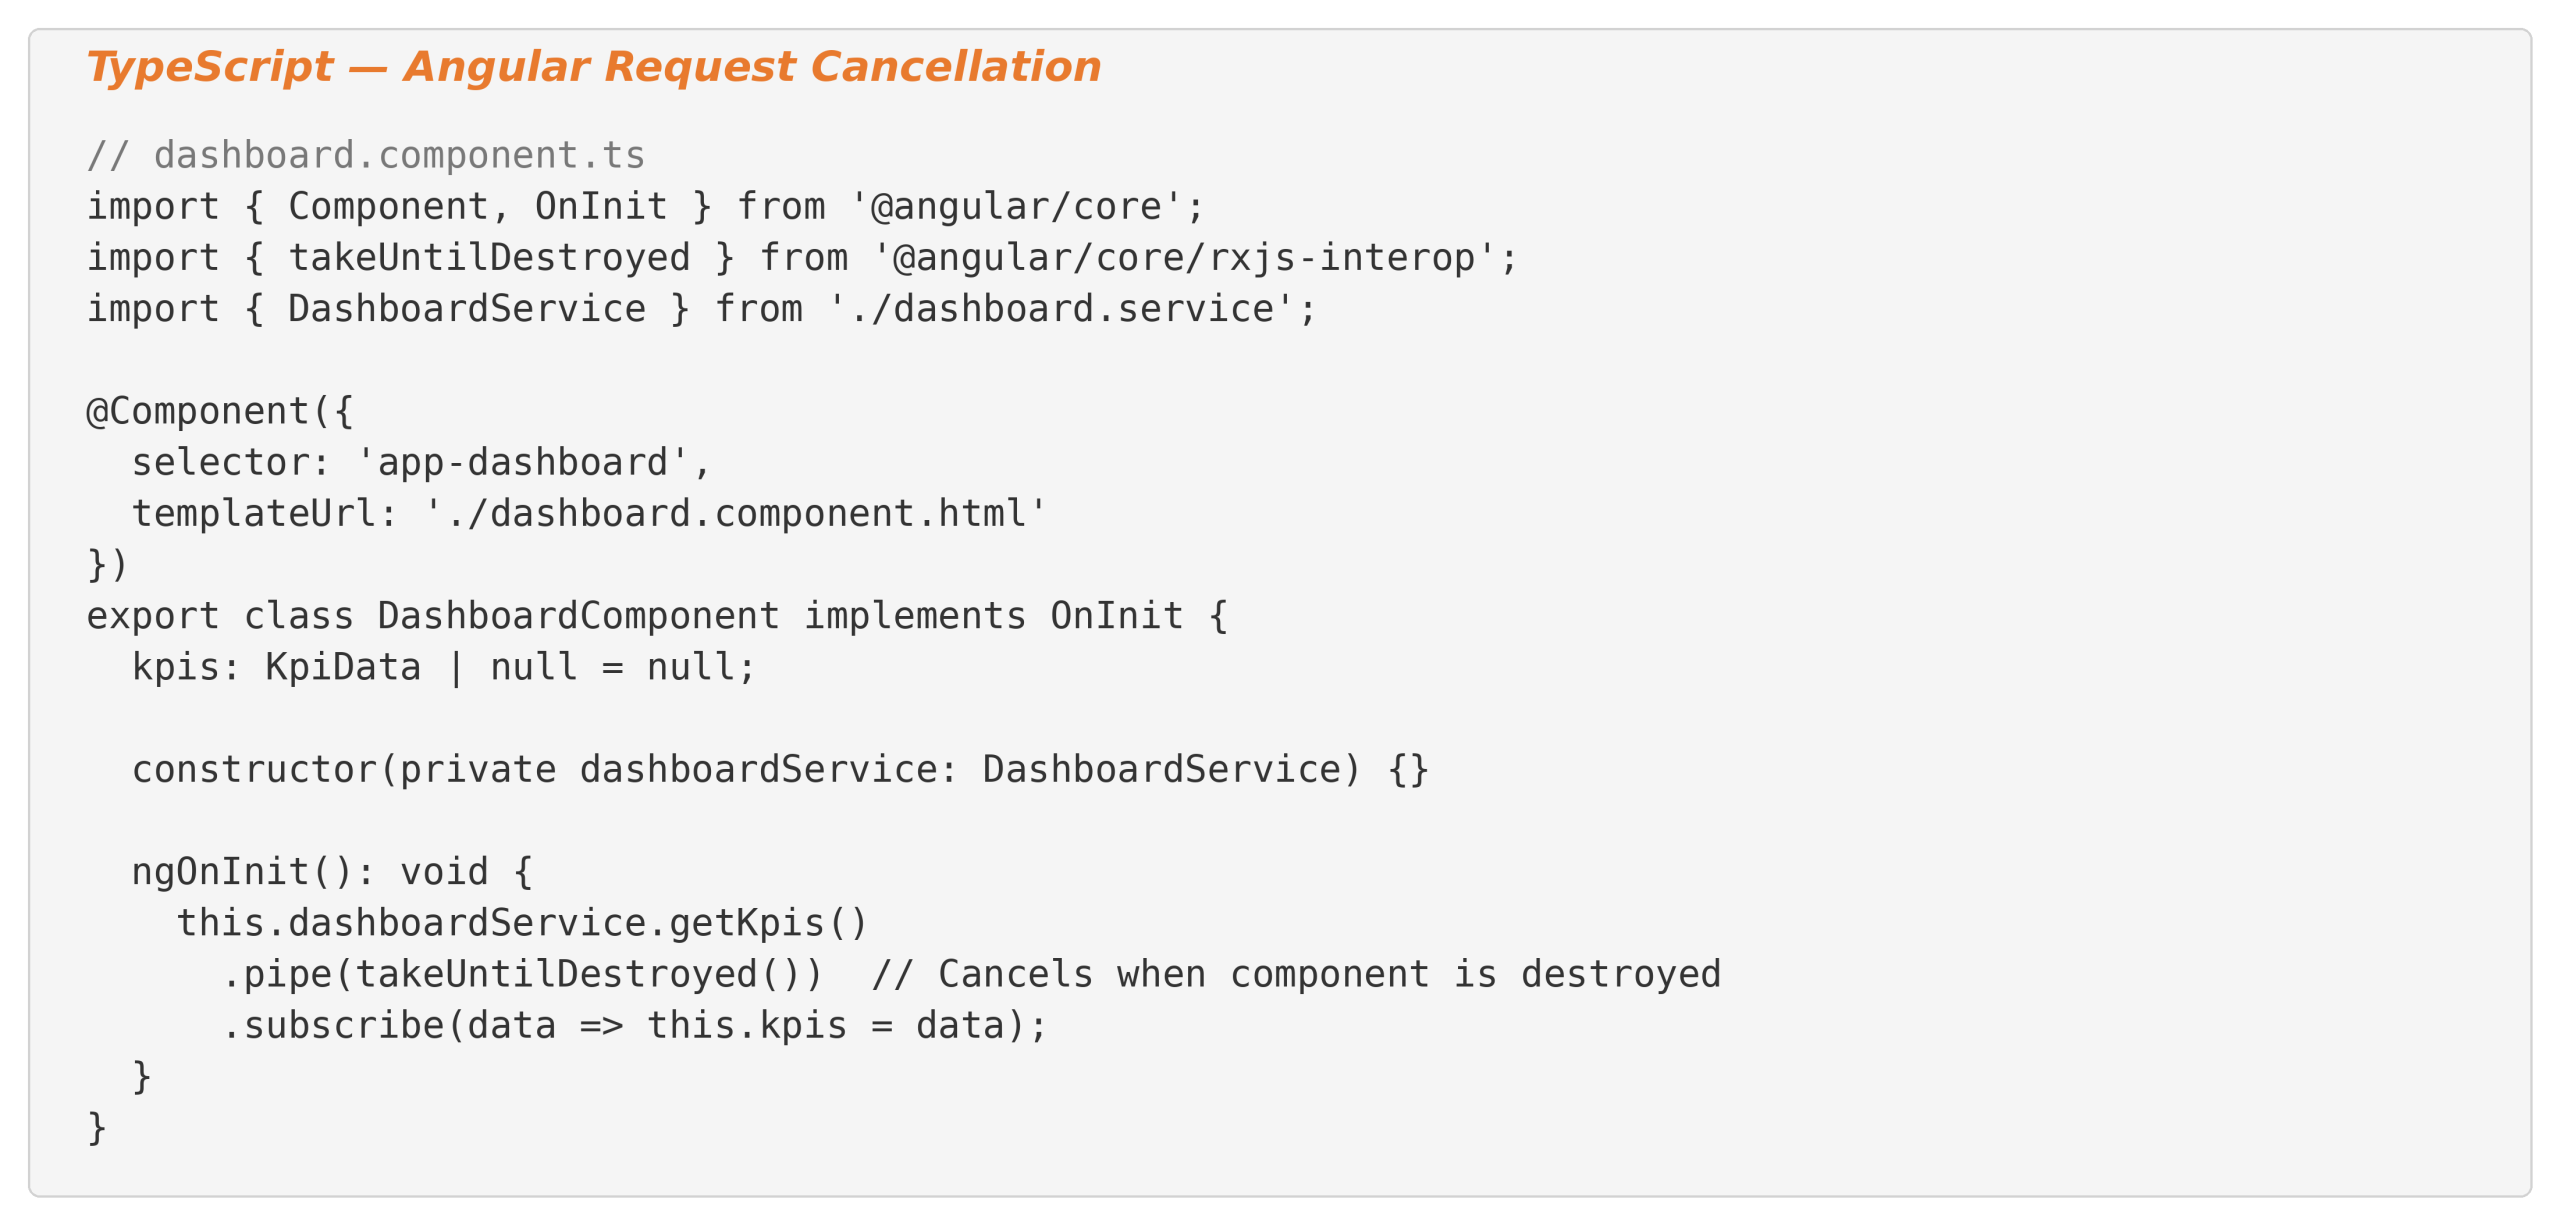
Angular Request Cancellation. Angular’s HttpClient returns Observables rather than Promises, so inflight requests can be cancelled when a user navigates away. Without cancellation, stale responses can overwrite current data; therefore, we applied takeUntilDestroyed across all dashboard components to cancel pending requests automatically.
Pattern 4:
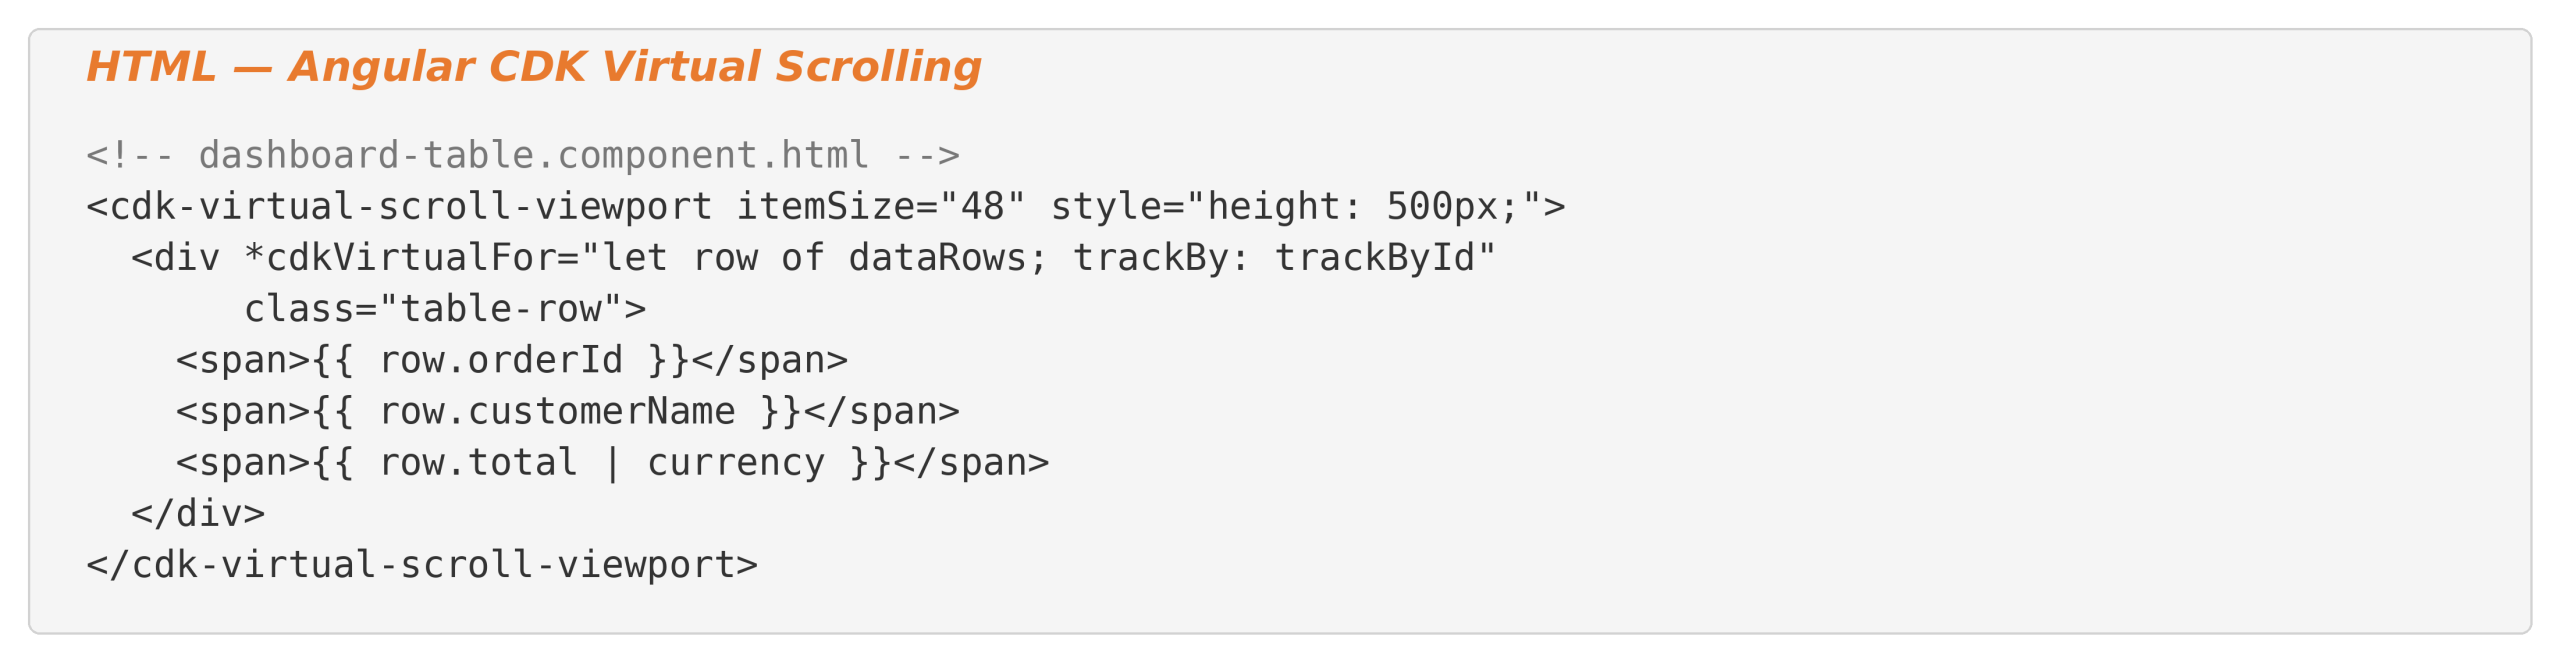
Angular Virtual Scrolling for Large Data Tables. Rendering 5,000 rows into the DOM at once degrades Angular rendering performance. Angular CDK’s virtual scrolling renders only the rows visible in the viewport, keeping DOM node count constant regardless of dataset size. The trackBy function is essential – without it, Angular re-renders every visible row on any data change.
Pattern 5:
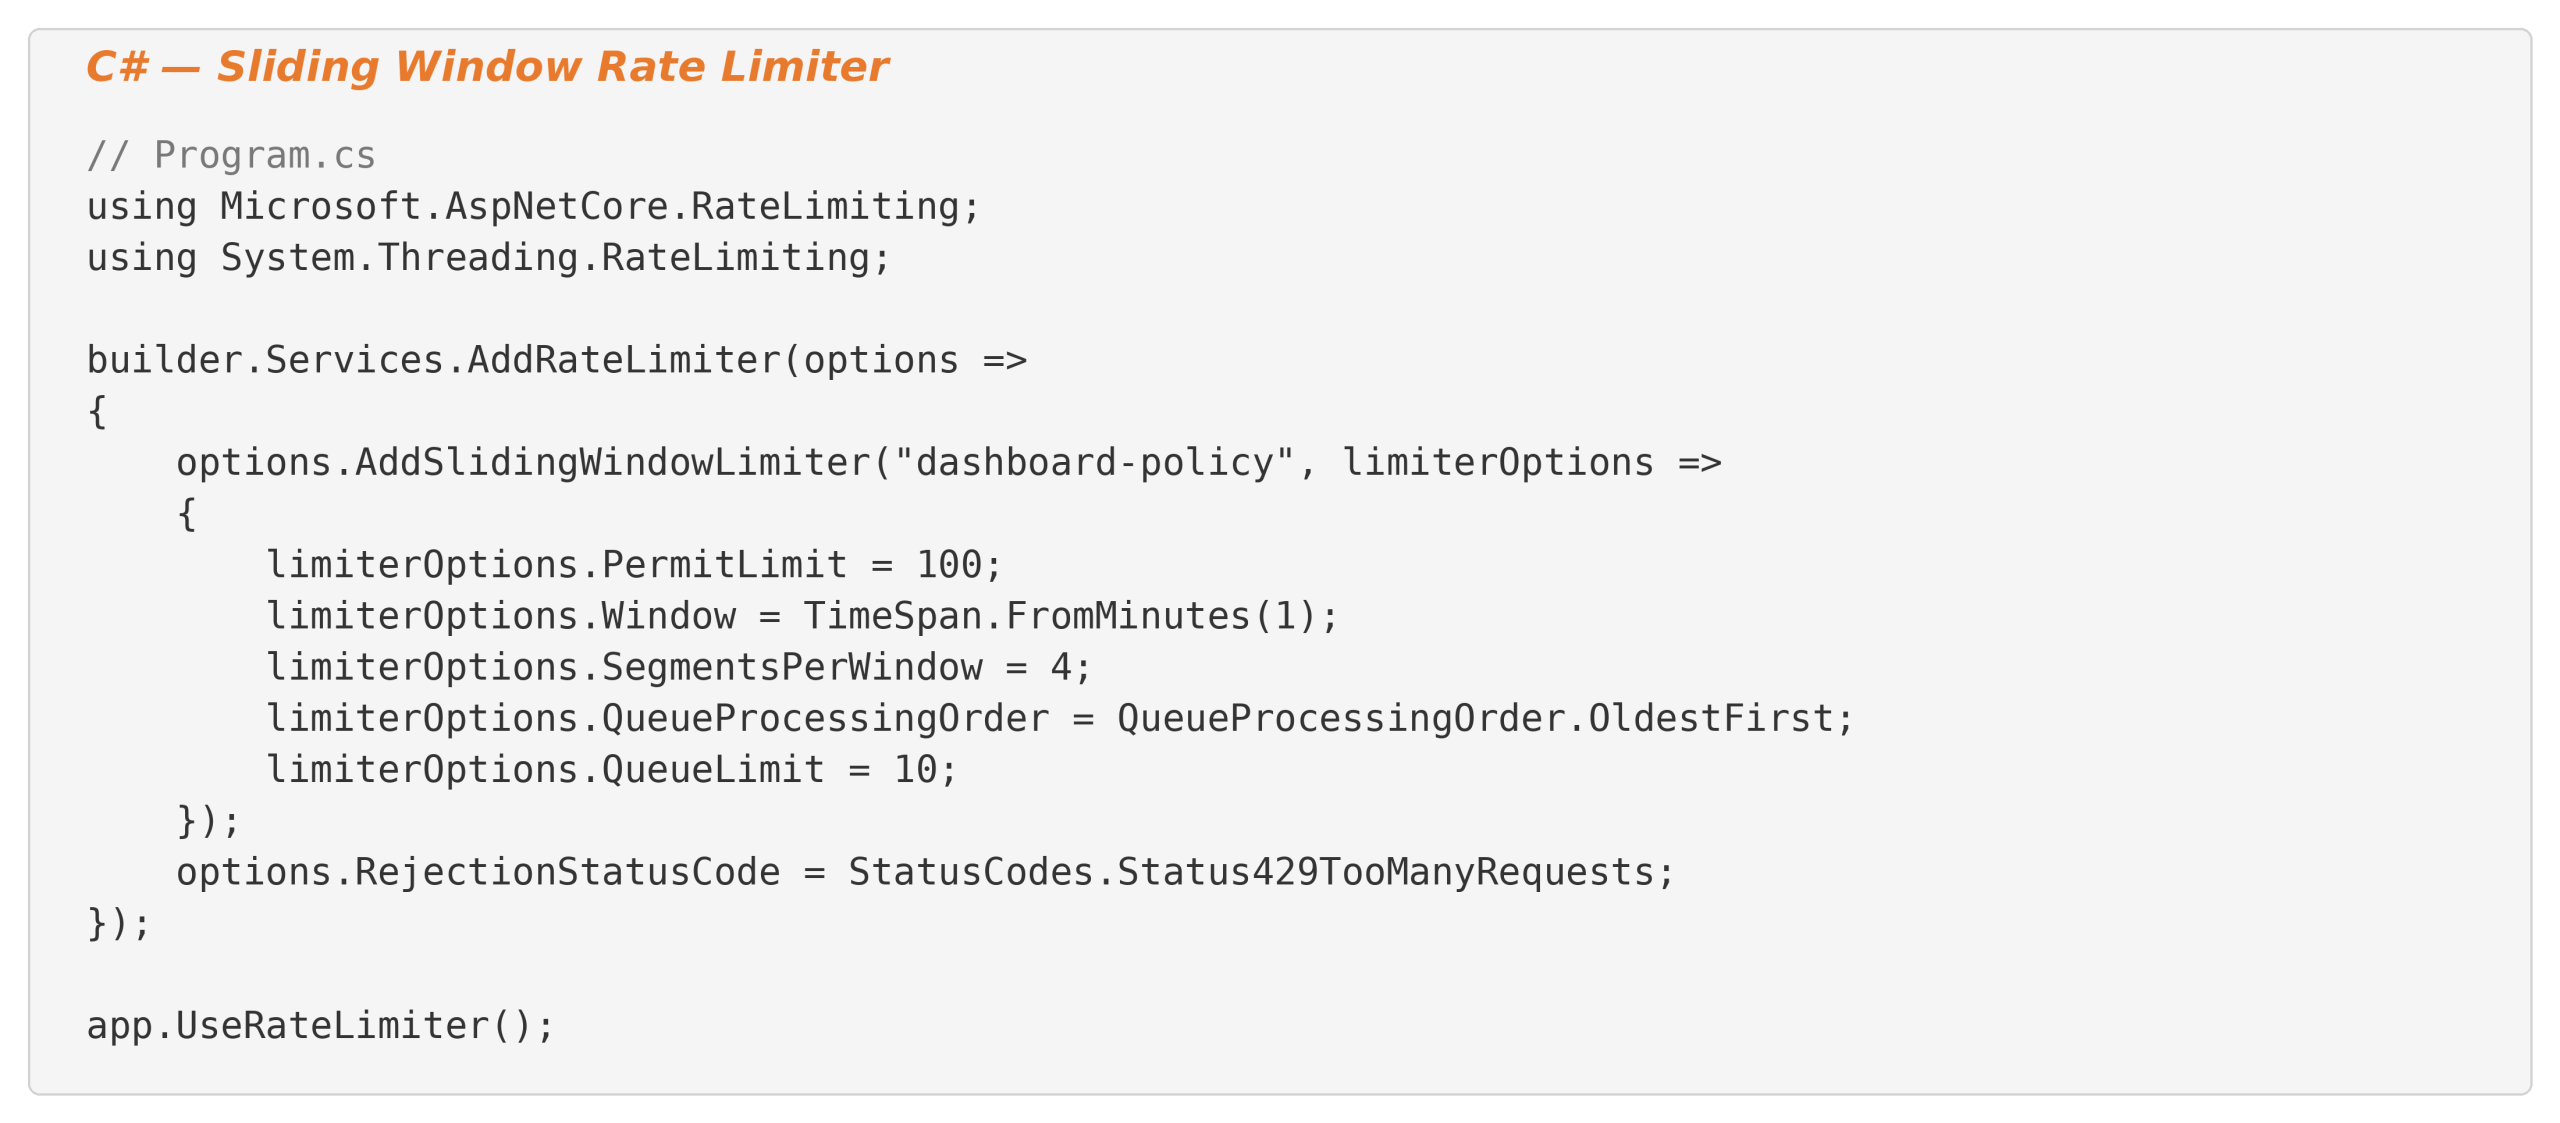
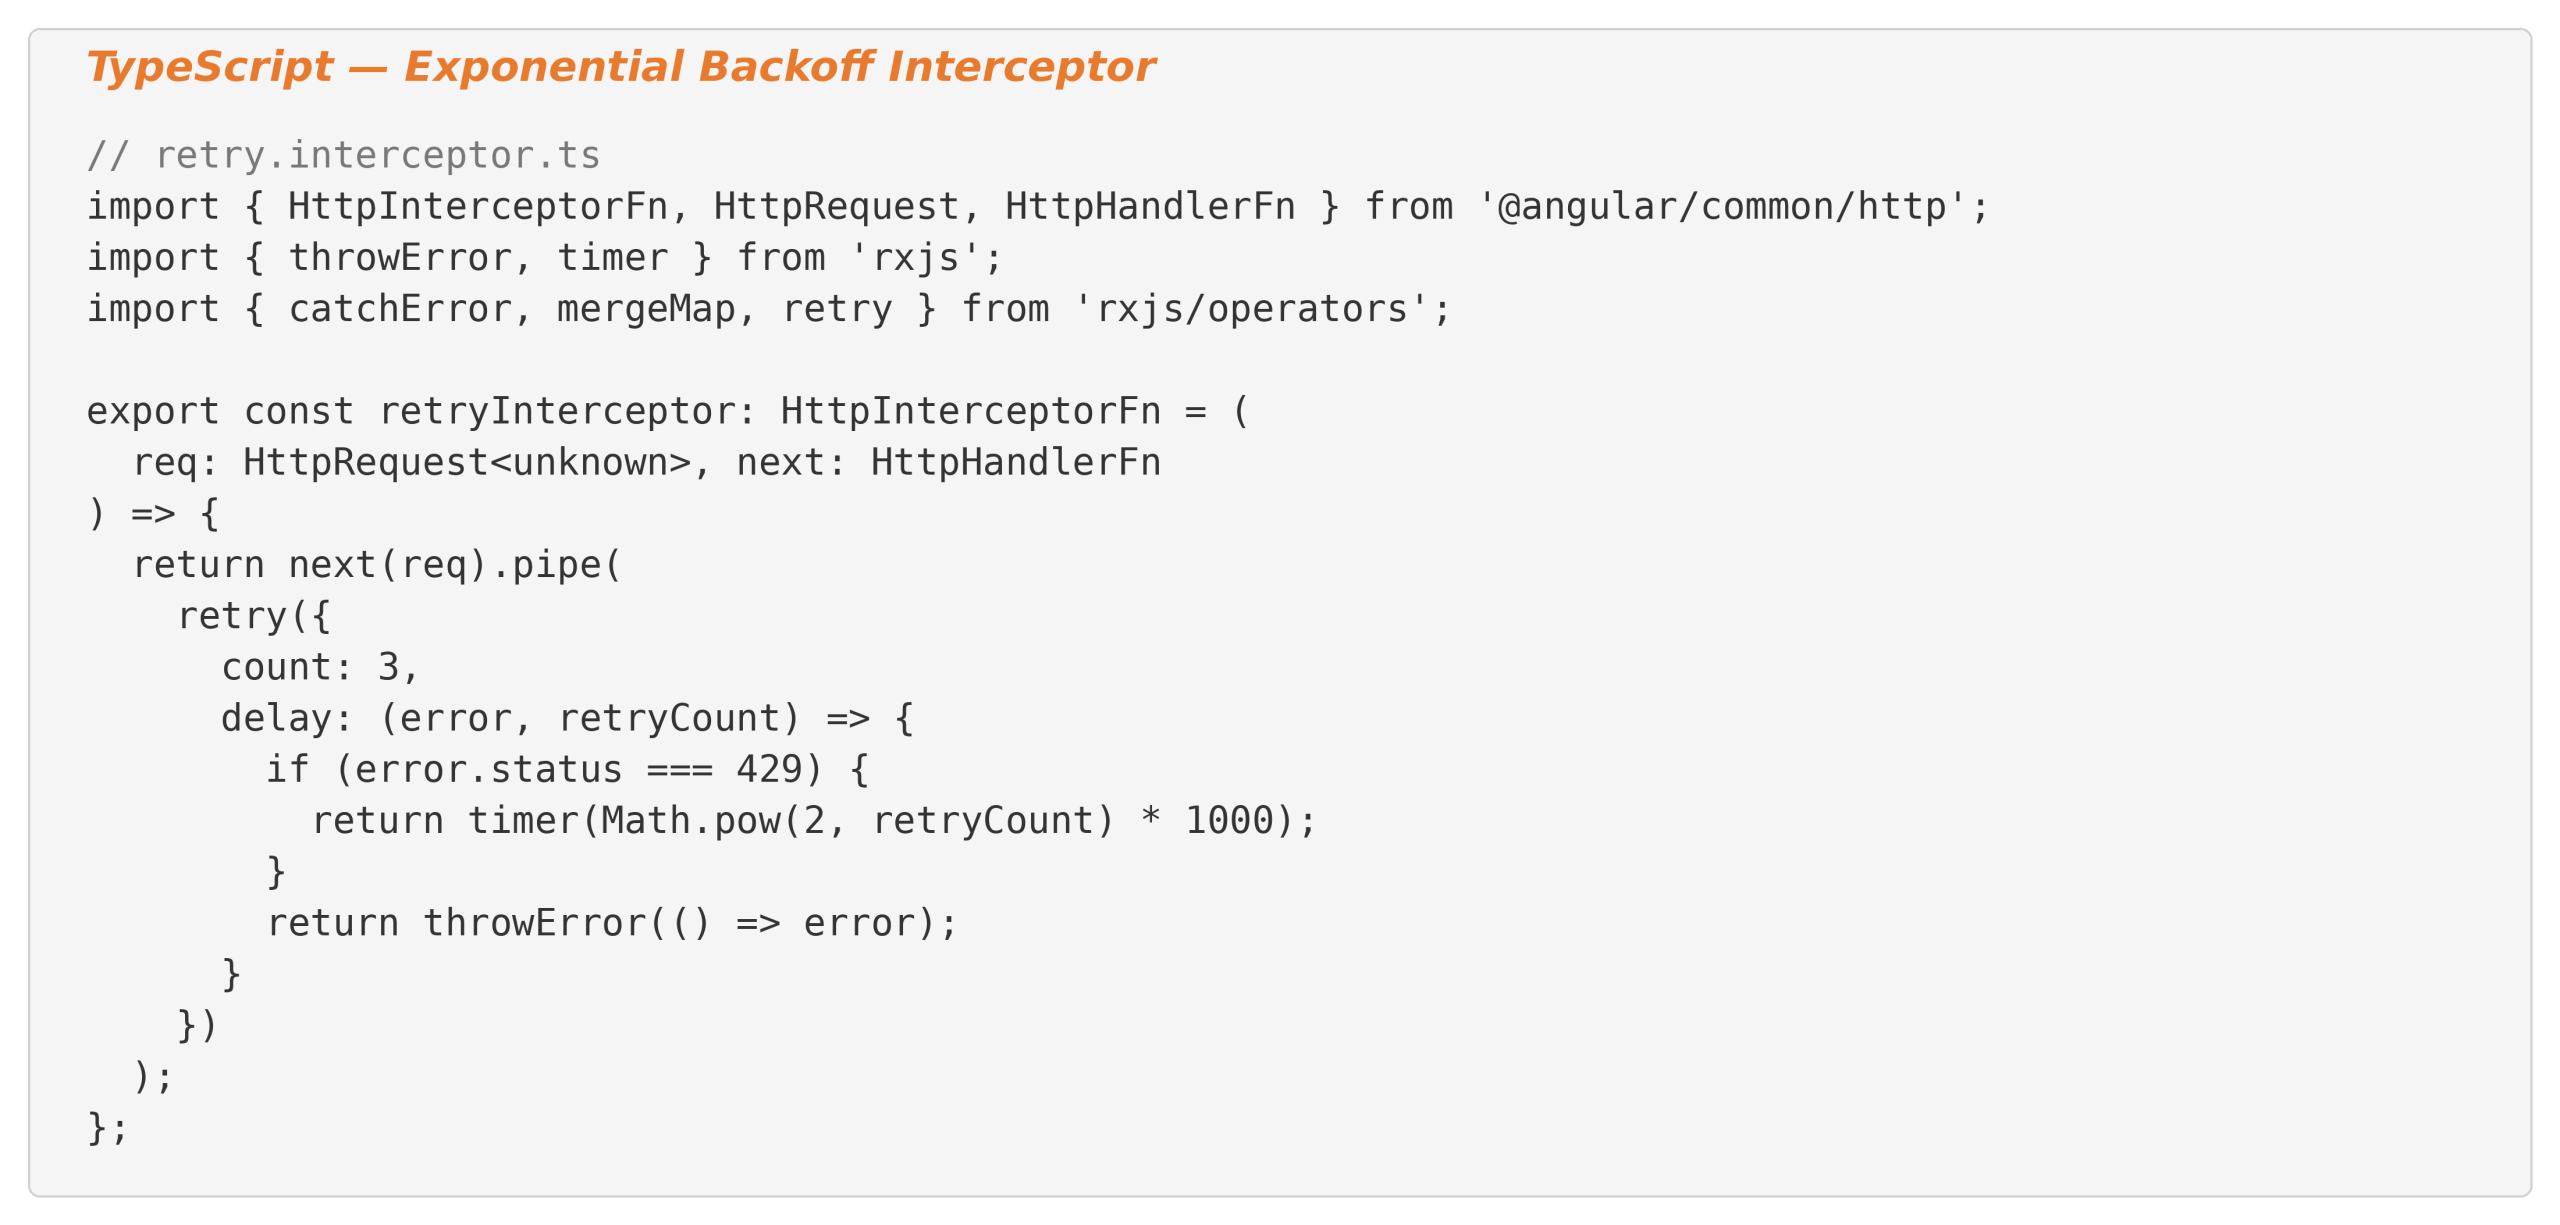
API Rate Limiting. No amount of front-end optimization protects the API if a rogue client hammers it with thousands of requests per minute. We implemented .NET Core’s built-in sliding window rate limiter using ASP.NET Core rate limiting middleware as a safety net, paired with an Angular HTTP interceptor that applies exponential backoff on 429 responses. Proper API rate limiting prevents a single misbehaving client from degrading performance for every user.
Pattern 6:
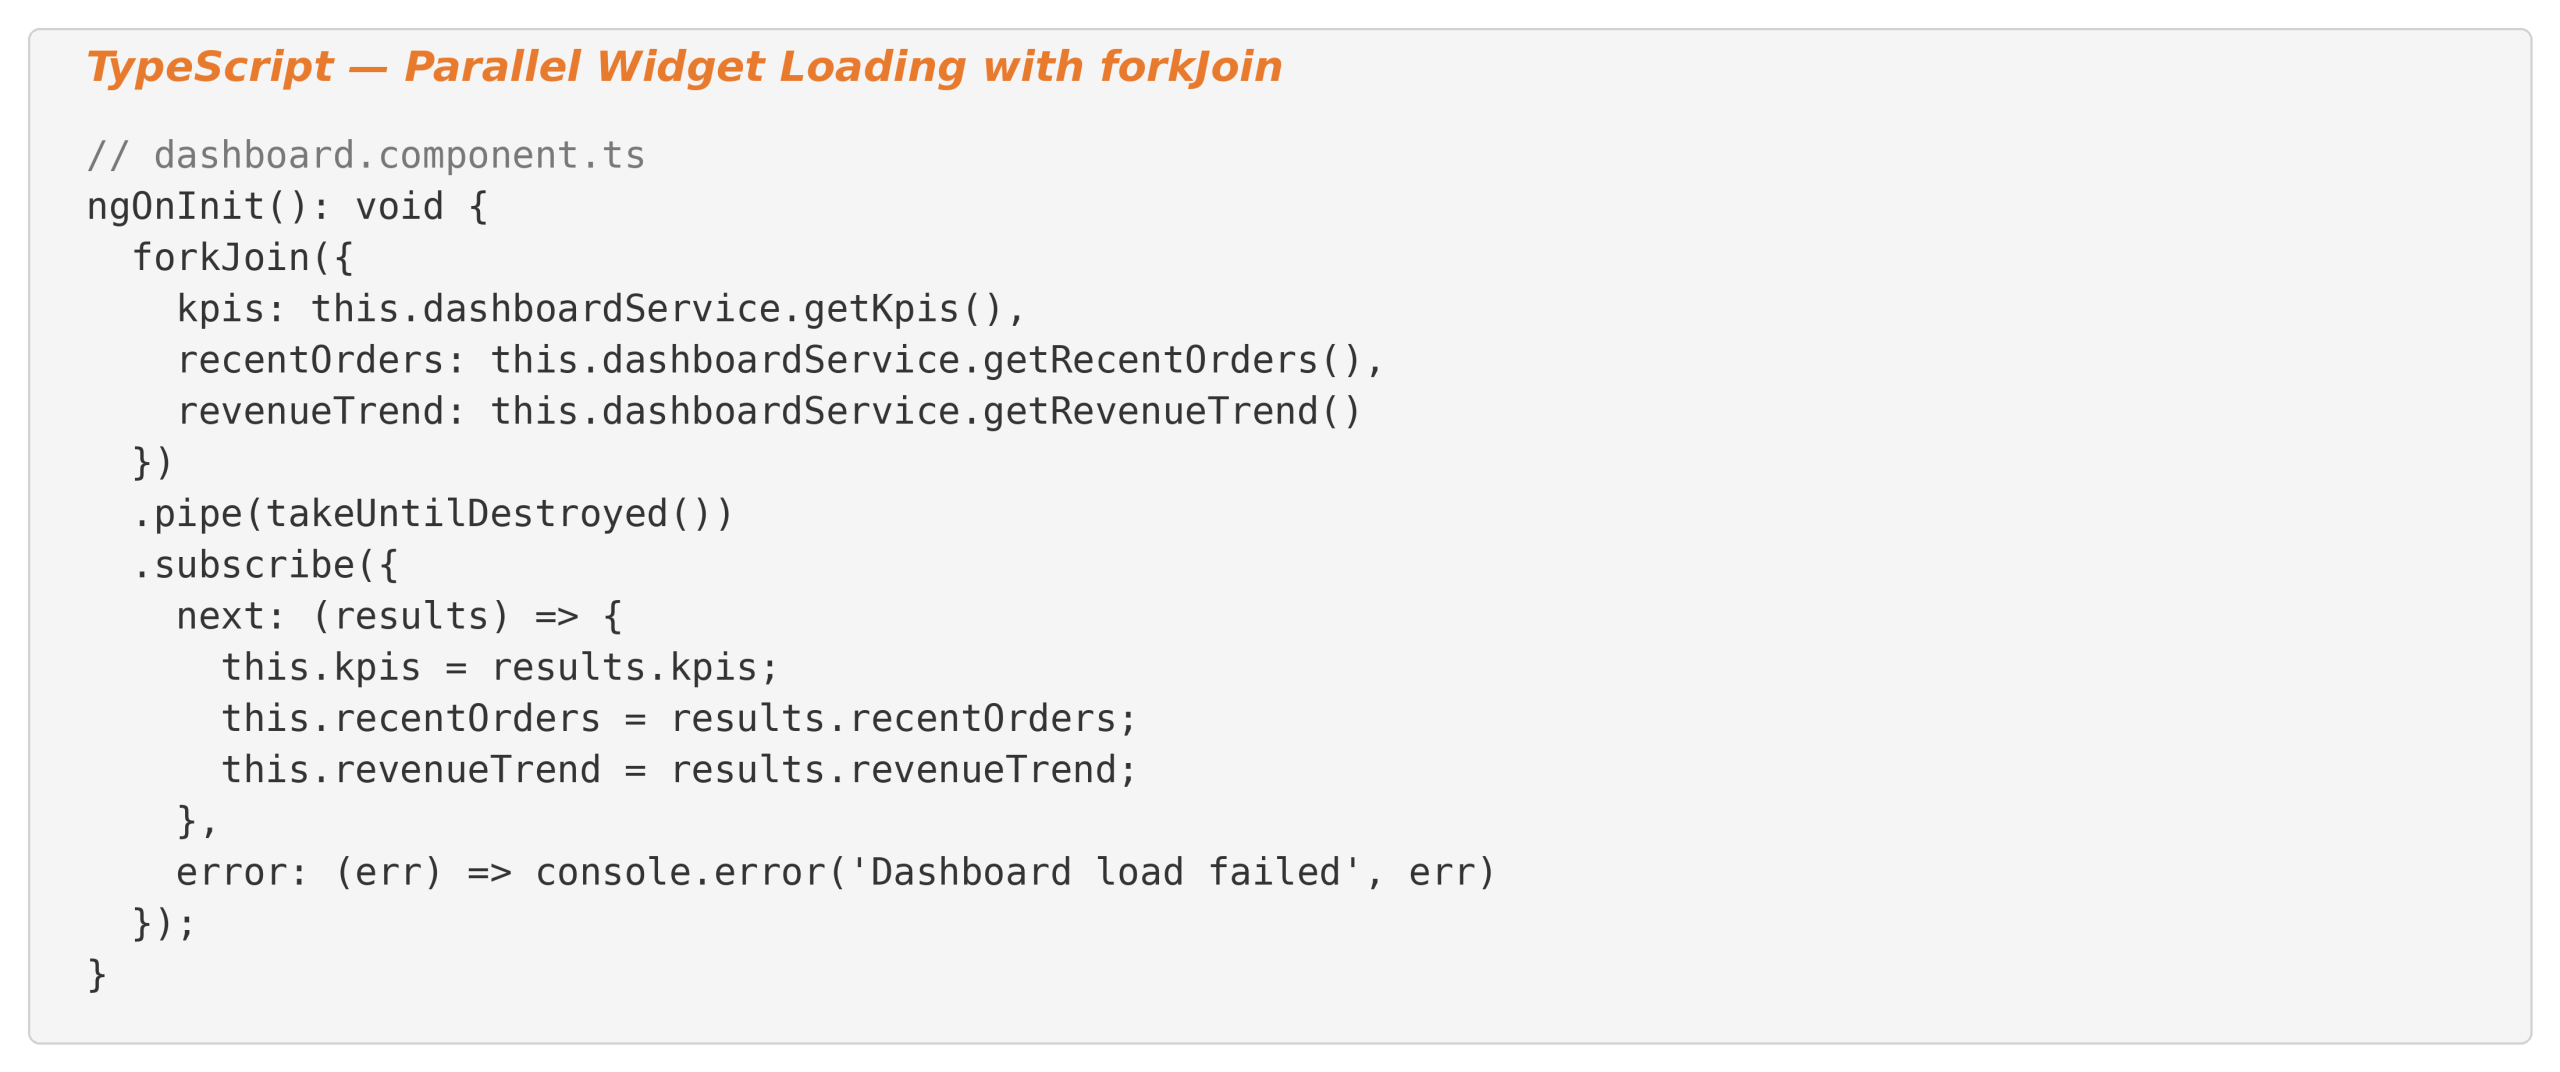
Parallel Widget Loading. Rather than waiting for the entire dashboard payload, we restructured the Angular component to fire all widget API requests in parallel using forkJoin. Users see fast-loading KPI cards immediately while complex trend charts complete in the background. Angular’s lazy loading with loadComponent further reduces initial payload size.
Validation
Load testing with a concurrency ramp from 100 to 3,000 simultaneous users confirmed that async database access eliminated thread pool exhaustion entirely. Redis caching reduced KPI endpoint database hits by over 95% during peak hours – a pattern that becomes even more critical for dashboards connected to real-time data pipelines on Azure where streaming ingestion adds constant database pressure. Angular virtual scrolling kept the DOM node count below 200 regardless of dataset size, and API rate limiting correctly throttled runaway clients without affecting normal users. Multi-tenant cache isolation was verified by running concurrent requests across multiple tenant IDs and confirming zero cross-tenant data leakage.
The Outcome: Dashboard Performance Before and After
After deploying the six scalability patterns to the client’s production environment – the same server, same database, same Angular and .NET Core versions – dashboard performance improved substantially across every measured dimension.

The key takeaway is that none of these performance improvements required infrastructure upgrades. The gap between a dashboard that works in UAT and one that holds up at enterprise scale comes down to applying concurrency-aware patterns consistently across both the Angular front end and the .NET Core API.
If your Angular or .NET Core dashboard is hitting similar bottlenecks under production load, our team at ScriptsHub Technologies can help you identify which of these patterns will have the biggest impact on your stack. Book a free architecture review at scriptshub-cms.azurewebsites.net/ before your next peak traffic window.
How to Improve Dashboard Performance on Angular .NET Core
Step 1: Convert Synchronous Database Calls to Async – Search the .NET Core codebase for ToList(), FirstOrDefault(), and other synchronous Entity Framework methods. Replace each with its async equivalent, wire CancellationToken through the endpoint chain, and add ResponseCache attributes with VaryByQueryKeys on read-heavy KPI endpoints backed by Redis.
Step 2: Optimize Angular Request Handling – Apply takeUntilDestroyed to every Observable subscription that calls the API to cancel inflight requests on navigation. Use forkJoin to fire all widget API requests in parallel so faster widgets render immediately. Apply lazy loading for below-the-fold widgets.
Step 3: Enable Angular Virtual Scrolling for Large Data Tables – Replace DOM-rendered data tables with Angular CDK’s cdk-virtual-scroll-viewport. Measure actual row heights for the itemSize parameter and implement trackBy for efficient re-renders.
Step 4: Add API Rate Limiting with Client Backoff – Configure .NET Core’s sliding window rate limiter on dashboard endpoints. Pair it with an Angular HTTP interceptor that applies exponential backoff when the API returns HTTP 429.
Step 5: Validate Dashboard Performance Under Simulated Load – Run concurrency ramp tests from 100 to target peak users. Verify thread pool health, cache hit rates, DOM node counts, rate limiter behavior, and multi-tenant data isolation before releasing to production.
Conclusion
In short, scaling an Angular .NET Core enterprise dashboard for enterprise-scale concurrency requires six architectural patterns: async database access with cancellation tokens, Redisbacked response caching, Angular request cancellation, virtual scrolling, API rate limiting with client-side backoff, and parallel widget loading. The gap between a dashboard that works in UAT and one that delivers consistent performance for 10,000 concurrent users is not a different framework – applying these patterns consistently across the full stack closes that gap.
ScriptsHub Technologies specializes in building and scaling enterprise web applications on Angular and .NET Core for clients across the US, UK, and India. If your dashboard performance is struggling under production load or you need an architecture review before going live, book a free consultation at scriptshub-cms.azurewebsites.net/. Follow us on LinkedIn for more technical deep-dives on scalable enterprise application development.
Frequently Asked Questions
Q. What is an enterprise dashboard scalability pattern?
A set of architectural practices – async I/O, caching, DOM virtualization, and rate limiting – that enable dashboards to serve thousands of concurrent users without degradation.
Q. Why does .NET Core dashboard performance degrade under high concurrency?
Synchronous database calls block threads. When the thread pool is exhausted, incoming requests queue up, causing cascading timeouts across the dashboard.
Q. How does Angular virtual scrolling improve dashboard performance?
Angular CDK renders only the rows visible in the viewport, keeping DOM node count constant regardless of dataset size, preventing change detection slowdowns.
Q. When should I use Redis instead of in-memory caching?
Use Redis when your API runs behind a load balancer with multiple instances. In-memory caches are per-instance and cause inconsistent data across nodes.
Q. What is the purpose of CancellationToken in .NET Core APIs?
CancellationToken stops a running database query when the client disconnects, preventing wasted server and database resources on abandoned requests.
Q. How does API rate limiting protect dashboard performance?
Rate limiting caps requests per client per time window, preventing stuck browser tabs or rogue clients from monopolizing server capacity during peak hours.
Leave a Reply